Fire Map Guide: How to Read, Use, and Build Effective Fire Mapping Systems
Published: June 16, 2026
What Is a Fire Map?
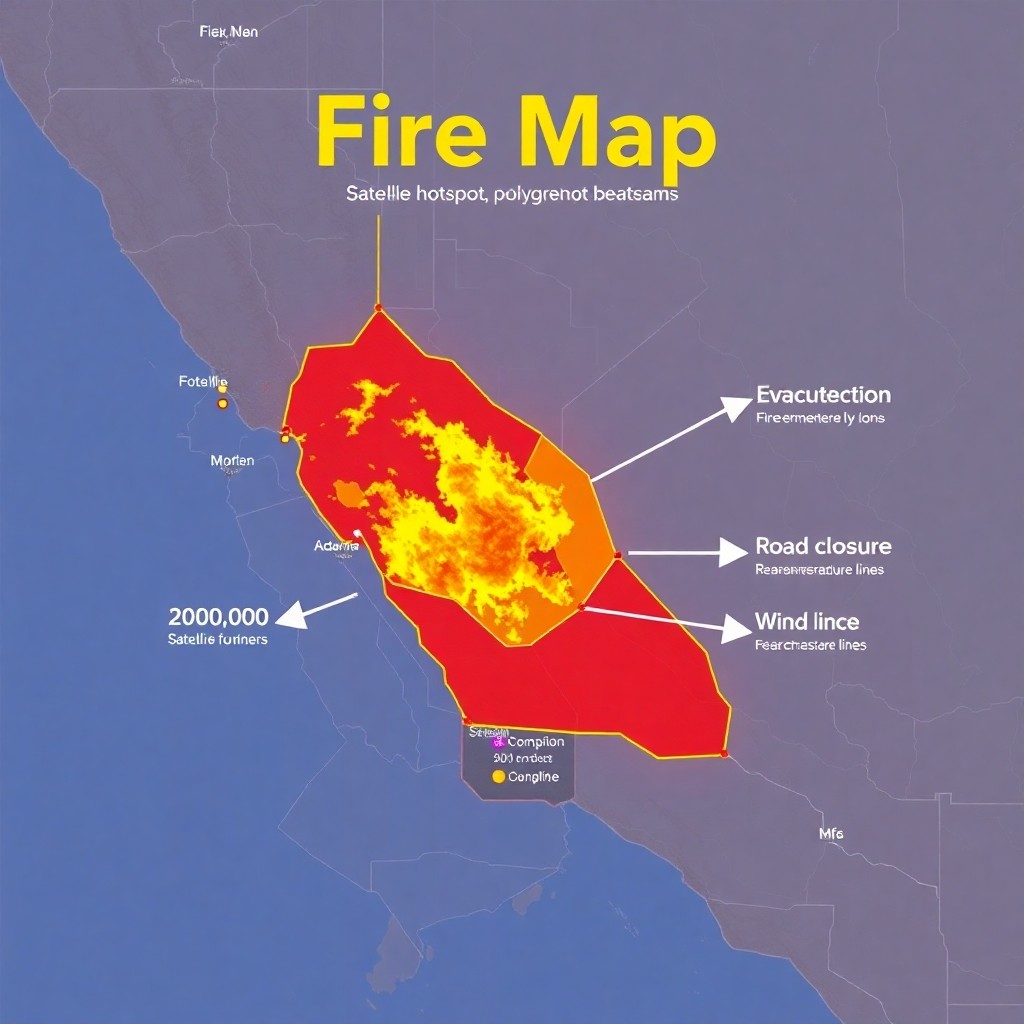
A **fire map** is a visual representation of wildfire activity and related risk information across a geographic area. Depending on the source and purpose, a fire map may show **hotspots from satellites**, **current fire perimeters**, **evacuation orders**, **road closures**, **weather and wind conditions**, **fuel types**, and even **predicted fire behavior**.
Fire maps are used by emergency managers, dispatch centers, first responders, utilities, media teams, and residents who need timely situational awareness. The best fire maps don’t just display raw data—they help people understand **what’s happening now**, **what could happen next**, and **what actions to take**.
---
Why Fire Maps Matter
Wildfires can spread rapidly due to wind, terrain, drought, and dry vegetation. A good fire map helps:
Because wildfire outcomes can change hour by hour, fire maps are often updated frequently—sometimes every 5–60 minutes for satellite-derived products and continuously for incident reporting layers.
---
Common Layers Found in Fire Maps
When you view a fire map, pay attention to the layers included. Not all fire maps use the same conventions, so always check the legend.
1) Hotspots and Detection Signals
**Hotspots** are typically derived from satellite sensors and indicate areas where thermal energy is detected.
2) Current Fire Perimeter
A **fire perimeter** is the mapped boundary of the fire at a particular time.
3) Evacuation Zones and Alerts
Many fire maps include **evacuation orders**, **warnings**, and **shelter locations**.
4) Road Closures and Access Routes
Road layers help answer practical questions:
5) Weather and Wind Risk
Wind speed and direction can determine whether fire spreads or intensifies.
6) Terrain and Fuel Information
Higher-resolution fire behavior depends on **slope**, **aspect**, and **fuel models**.
---
How to Read a Fire Map (Quick Checklist)
Whether you’re looking at an official government incident map or a community dashboard, use this checklist:
1. **Check the timestamp** on each layer.
2. **Verify the legend** (colors and symbols differ across platforms).
3. **Distinguish hotspots from perimeter edges**.
4. **Note evacuation status** separately from “nearby” risk.
5. **Look for wind direction**—especially if the map includes forecasts.
6. **Confirm the geographic reference** (street view vs. satellite base vs. abstract grid).
If a map has no timestamp, no source attribution, or unclear symbology, treat it as less reliable.
---
Best Practices for Using Fire Maps as a Resident
If you’re a community member using a fire map to decide what to do:
---
Building a Fire Map System: Architecture and Workflow
If you’re designing a fire mapping solution—whether for public communication, internal operations, or research—your system should prioritize clarity, reliability, and update cadence.
Step 1: Define the Use Case
Start with a narrow purpose:
Different goals require different layers, confidence levels, and update frequency.
Step 2: Choose Data Sources
Typical inputs include:
Ensure you include metadata: **source, acquisition time, projection, and quality flags**.
Step 3: Normalize and Validate Data
Data inconsistencies are common. Validate:
Step 4: Design a Clear Map UI
Good fire maps are intuitive under stress.
Step 5: Add Risk Logic (When Appropriate)
Not all projects need predictive modeling, but many benefit from risk heuristics like:
Be careful: risk scores should be labeled as estimates and not guaranteed outcomes.
Step 6: Publish and Update Reliably
Delivery matters as much as accuracy.
Step 7: Accessibility and Offline Considerations
Public systems should consider:
---
Common Pitfalls to Avoid
---
Fire Map Trends: What’s Next?
The field is evolving rapidly. Expect more:
---
Conclusion
A fire map is more than a colorful image—it’s a decision-support tool that translates complex environmental signals into actionable information. Whether you’re interpreting a public wildfire dashboard or building your own system, the keys are the same: **use accurate data sources, keep timestamps clear, design for real-world urgency, and separate directives from estimates**.
If you want, tell me your goal (e.g., “public wildfire alerts,” “incident operations,” or “personal preparedness”) and the region you care about, and I can suggest a layer set, update strategy, and example layout for your fire map.